Anyone in the market to buy a home knows how competitive and stressful it has been lately. Whether competing in multiple offer scenarios, watching the interest rate increase 2.5% points since the beginning of the year, or getting priced out of a neighborhood you could have afforded last year or even month, it has become a little disheartening.
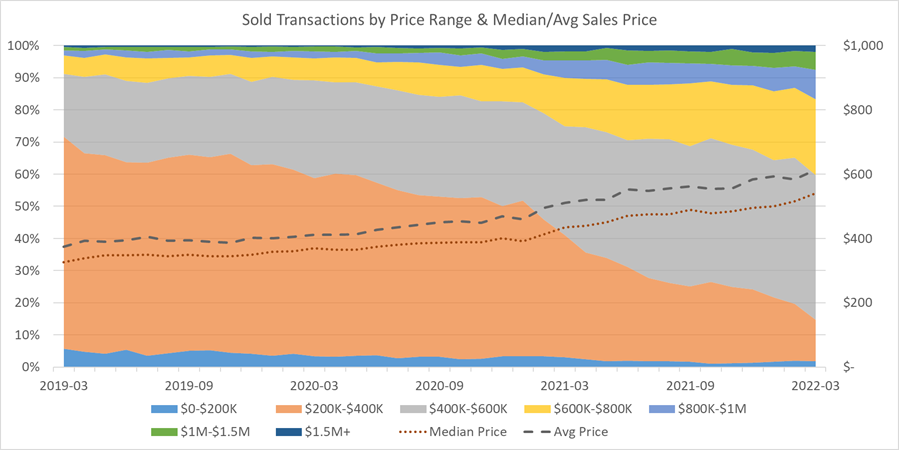
It was this last distressing thing, home prices, that I started thinking about quite a bit after my last post, Is Cash King for Making the Winning Offer?. In the news we hear mostly about either the Average or Median Sales Price. I wanted to know how much the different price ranges have changed. As I dove in, I found several things in the results that were shocking.

First, from March 2019 through March 2022, there was a 53-basis point (from 66% to 13%) decline in the # of Sold Transactions in the $200K-$400K price range. Yes, you are reading that correctly. 66% of the homes that sold in March 2019, sold between $200K and $400K, and now it is down to 13%.
Second, the decline in the $200K-$400K price range, really began to tumble at the beginning of 2021, which is when I remember hearing homes having upwards of 100 offers. Then, there was a slight recovery/stabilization last fall, but overall, 2021 lost 47-basis points on its own.
The good news at least is there are still homes to purchase under $400,000, about 15% of the market, which in some US cities is unheard of. It is only that they may not be what you are looking for or they are in an area you are not interested in.

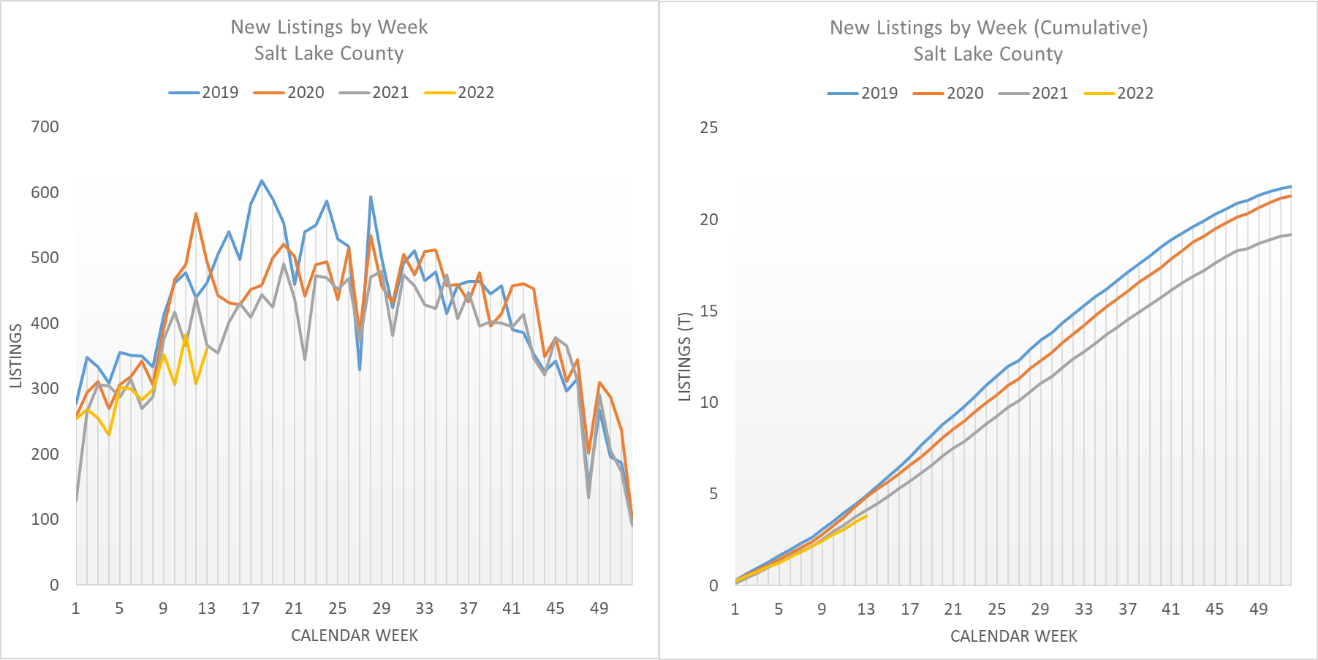
In addition to looking at price ranges, I want to clear one thing up the news has been reporting lately, “Limited Inventory”. As of the beginning of April, we are trending fairly close to what we saw in 2021. Yes, 2022 Listings are a little lower right now, but with everything going on in the world (Russia, Interest Rates, Inflation & Home Prices), I do not think it is all that bad. Also, you can see in the left graph, listings in Salt Lake County are on the rise, as is the case every year around now.
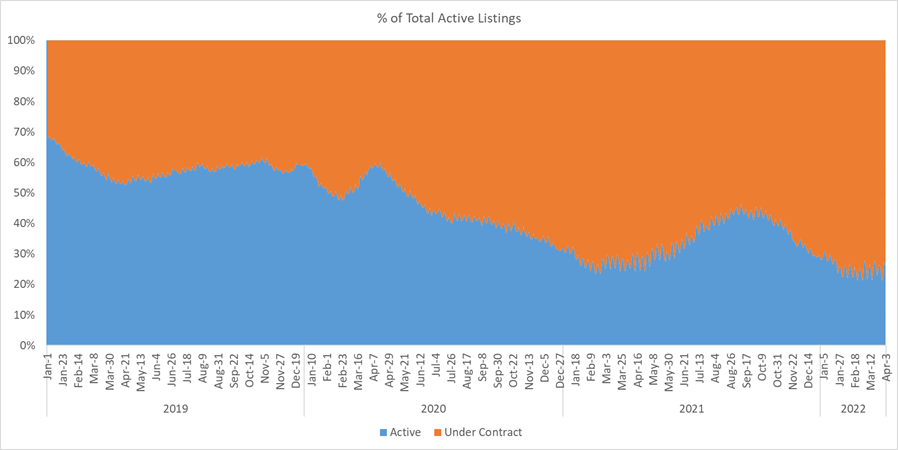
In fact, one of the other things I monitor is the % of listings Under Contract to what is Active. I am seeing some leveling off in the metric, which indicates the supply & demand are holding stable. And, as we begin the “listing season”, does this levelness point to a pending increase daily inventory, or supply is starting to increase faster than demand?

Last, some feelings-based data. I have talked with quite a few people about the uneasiness being felt in the market. In general, I think a lot of people are experiencing a “wait and see” mentality, due to the uncertainty around the war in Ukraine and what it may become and then what our economics are doing.
Buying a home is always a risk, since it is a huge outlay of money (borrowed or not). You have to remember things change all the time and the only thing that can be done is to prepare as much as possible. There is never a good or bad time economically to purchase a house, if you plan to stay in it long-term. So, the only question to ask is “Am I prepared and ready to Buy?”
Anyway, thanks for your time. If you’d like to connect or share your thoughts, I can be reached via email at craig@craigtheagent.com.
P.S. Also Follow me on: Facebook, Instagram and LinkedIn. All charts were derived from UtahRealEstate.com data.


 Facebook
 X
X
 Pinterest
 Copy Link