

 Facebook
 X
X
 Pinterest
 Copy Link
It is not a secret, but what is the easiest way to accumulate wealth? By investing in real estate. We all need somewhere to live and for most people this means having some version of a home payment, rent or mortgage. In this article, I am not going to discuss the reasons to buy a home but show the long-term benefits of having a mortgage. Even cash buyers should take this into consideration for after they close.
Why you ask? Well between a home’s appreciation and the stock market’s growth, the cost of borrowing (i.e., the Interest Rate) is normally going more than offset. Since 1996, in Salt Lake County (SLC) the average home appreciates 6.5%/year and the Dow Jones Index (Dow) at 8.2%/year, while the interest rate averaged 5.3%/year. Even if you exclude home appreciation for 2020 through today, appreciation perfectly offsets interest, not to include the fact interest is tax deductible.
So, it only makes financial sense to carry a mortgage on a home and to invest any cash beyond your required down payment in the stock market. This is the high-level argument I will make but keep reading if you want to see the details.
 The data for this article only focuses on SLC since 1996, which is as far back as Utah’s MLS data goes. This does not mean the principles we discuss are not applicable other places, only that the Home Appreciation will be different. Also, I am using the Median Valued house, not Average. The Average is skewed by the high-priced homes, and not what most buyers are paying. As of March 2022, Median is $625K while Average is $691K.
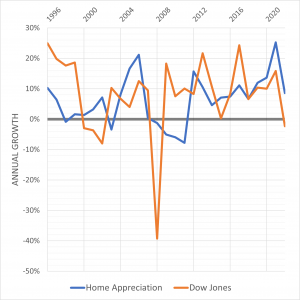
This first chart outlines the average home appreciation and Dow’s performance. In 26 years, home prices have only lost value twice (blue line dipping below 0%). And even though 2022 looks like it is collapsing, the year-to-date of 8.6% appreciation is only through March. The Dow had also seen 2 dips, however 2022 is at a loss right now. You will also see; the Financial Crisis of 2008 decimated the Dow (39% Loss) while homes lost 31% of their value from June-07 to Jan-12.
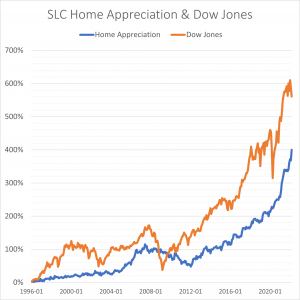 In this next chart, the same home appreciation and Dow performance is presented, but instead of looking at just the annual return, it shows the compounding effects of an investment. Over the same 26yr period, these effects on home appreciation is 4x and the Dow is 5.6x the original investment. This goes to show how time on an investment can make a huge difference.
This final chart has a lot going on and is going to take a little imagination. Also, I can only hope there is some exaggeration in bars for the more recent years. To start the top of each bar represents the estimated median home value after 30 years. Here is an example value for homes purchased in January 1996, followed by how each block is calculated:
- $920,196 = January 1996 Median Home Price of $125K after 30yrs of appreciation. Calculated using 0.56% monthly appreciation, which is the average from Jan-1996 to Mar-2022 (303 Months).
- $25,000 = 20% Down Payment
- $100,000 = Principal balance of a 30yr Mortgage
- $138,835 = Total Interest paid on a 7.03% – 30yr Mortgage issued Jan 1996.
- $111,542 = Property Taxes and Homeowners Insurance over the course of 30 years. Using today’s rates but adjusting property value each year to the new median.
- $284,215 = Value of 20% Down Payment if invested in the Dow Jones Index. Calculated using 0.7% monthly appreciation, which is the average from Jan-1996 to Mar-2022.
- $260,603 = Remaining balance of appreciated value.
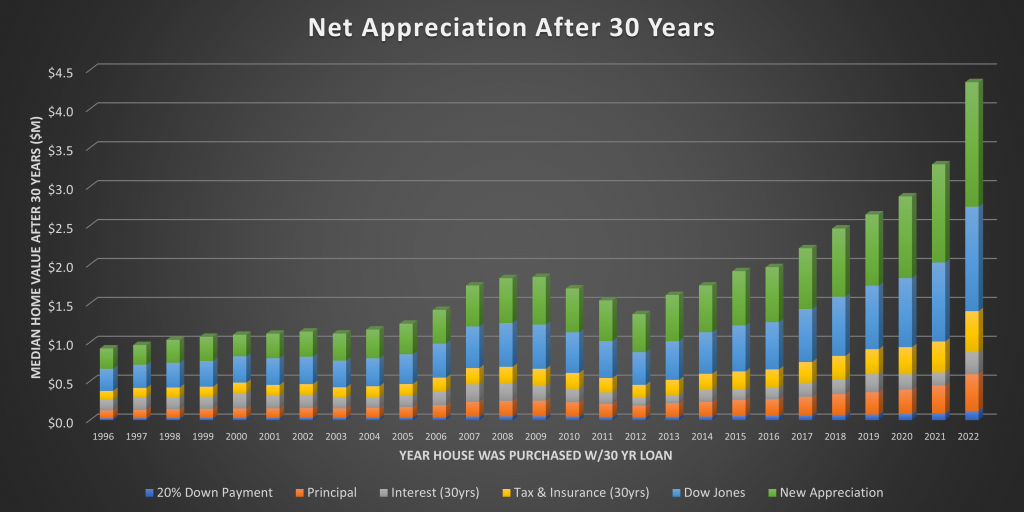
Yes, the first and last numbers in this list are correct and 100% shocking. Sure, it doesn’t account for the 1% of your homes value you should put aside each year for maintenance/updates, the initial closing costs, the fact most people carry PMI as they do not have 20% down, the tax deduction from annual interest or the stock market gain you could have realized on all the expenses.
But it is an impressive number non the less since it was due to money you initially borrowed. And to know you will get all those expense outlays back at some point, should make you feel pretty good.
So, to the exaggeration of this graph, the market itself and this model in general. In the bar for homes purchased in 2022, the future 30-year value is ~$4.3M. SLC has seen unprecedented home appreciation over the last 26 years, related to several demand-based reasons, like jobs & skiing. But not all markets have done as well, and the demand in SLC could change at any moment.
Take Dayton, Ohio, where the median home sold for $86.5K in 1996 and in March 2022 was $129.9K, and yes, they have seen the same price appreciation as SLC over the last few years. Talk about opportunity costs. At least homes are super inexpensive. It could be argued it is not worth owning in those areas as expenses will more than outweigh appreciation over time.
This does makes me wonder what will happen here in the next 30yrs thought. Parts of California have been able to sustain high prices and appreciation for a while now. Do you think we will be able to do the same?
Anyway, thanks for your time. If you’d like to connect or share your thoughts, I can be reached via email at craig@craigtheagent.com.
P.S. Also Follow me on: Facebook, Instagram and LinkedIn. All charts were derived from UtahRealEstate.com data.
