

 Facebook
 X
X
 Pinterest
 Copy Link
Salt Lake County Housing Trends – 2020 Year End Review
2020, What a year! There are so many things to discuss, but probably the most exciting part is it is finally over. However, just because the year is over, it does not mean things for buyers are going to improve.
Some metrics I think are interesting.
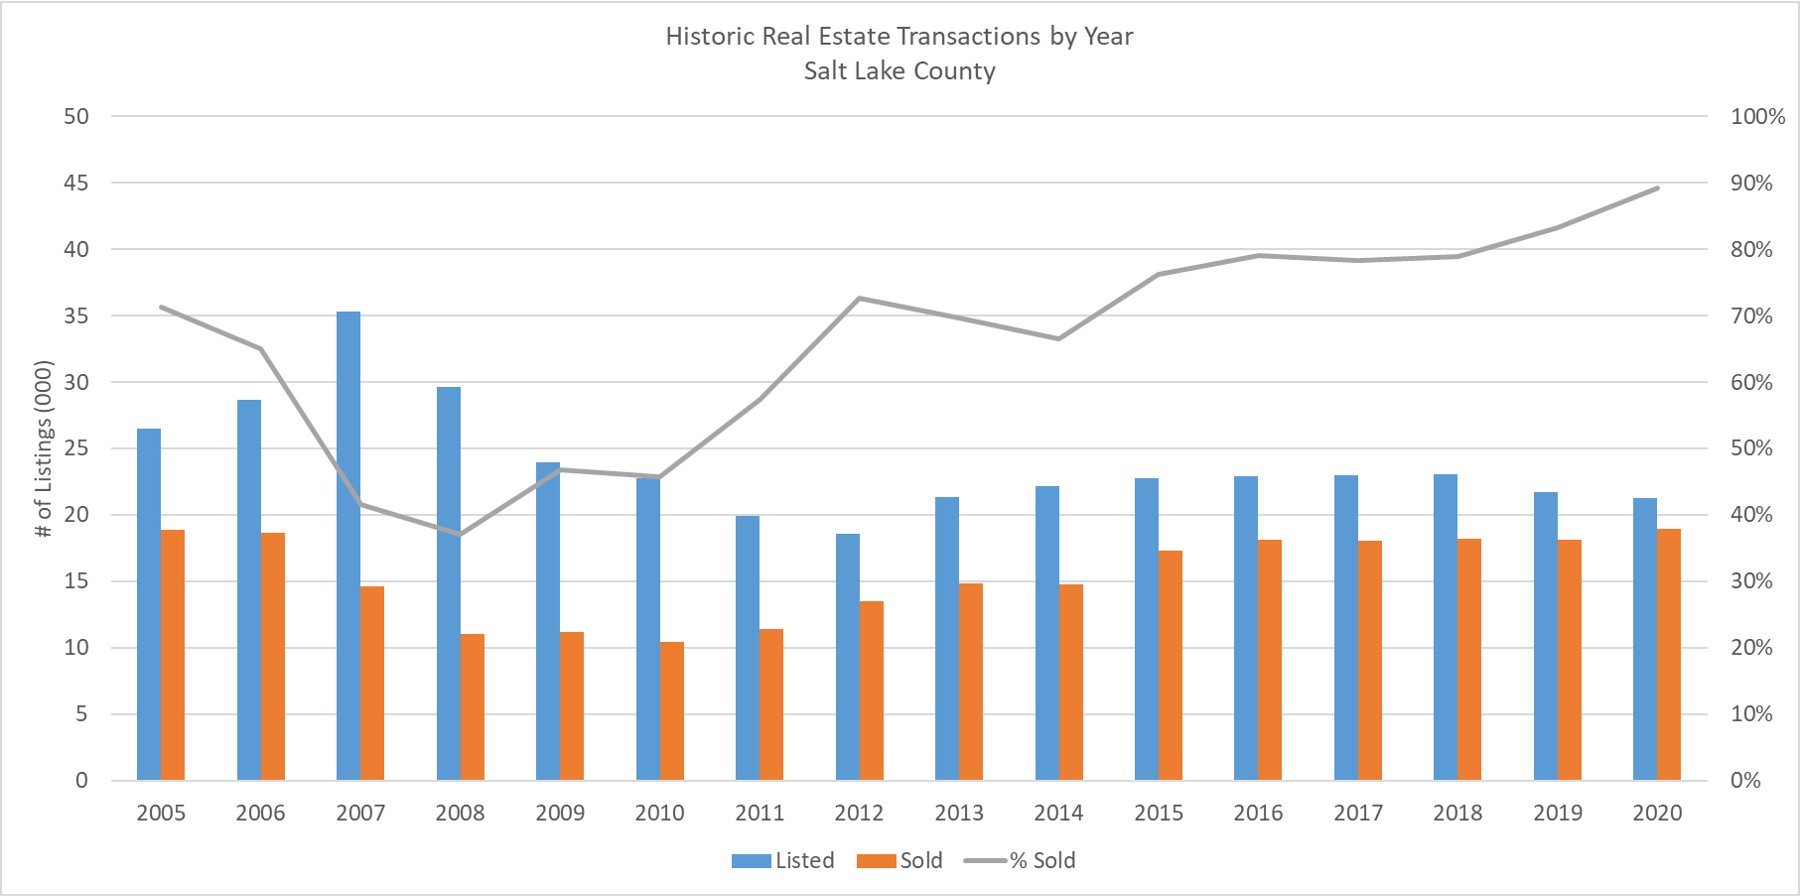
· 2020 surpassed 2005 becoming the highest year of Sold Listings, having 20% fewer available.
· 89% of all new listings in 2020 sold.
· The # of Sold homes in Q4 2020 was 10% higher than any other Q4.
· Daily inventory began 2020 around 1800 Listings and ended around 750. A 58% decline.
· 2020 only had 3% fewer listings than 2019.
· Q4 Avg Sales Price across the Zip Codes was 15% higher than Q4 2019.

So, how does this translate to 2021? It is hard to say exactly because there are so many unknowns with future federal stimulus packages and how they will impact homeowners who are behind on mortgage payment. Many distressed Sellers also have quite a bit of equity now in their homes, so a large # of foreclosures is unlikely. I wonder for those that are unemployed, if the banks will start letting them refinance to access the low rates and to wrap deferred payments into the new loan?
We do know flexible work arrangements are now going to be the norm and Utah/Salt Lake is a desirable location due to our access to the outdoors and strong economy. It is also highly likely mortgage rates will stay excessively low for the foreseeable. So, I believe the short answer is, it will continue to be a seller’s market here in Salt Lake County as there will continue to be high demand from buyers
As a Buyer, I will tell you to be flexible in your wants and needs and potentially be willing to limit some to the things you ask Sellers for as part of your offer.
For Sellers, if you want the most money from the sale of your home, make some small investments in paint and flooring. These two things will really change how buyers will respond to your property.
Results for December 2020
Not much is changing in the Salt Lake Valley as the year ended. Dec new listings did surpass 2019’s and the market finished with only a 3% deficit to 2019. Listings Under Contract decreased slightly and Daily Inventory declined as demand continued to outpace supply. Lending is staying stable as rates hover around 2.75%.
This first graph shows the # of Active Listings and those Under Contract. This represents a version of Supply (Active Listings) and Demand (Listings Under Contract) for Salt Lake County. Historically, Supply has always been higher than Demand, but the lines crossed just before COVID-19 started ramping and then again after the restrictions began lifting, and this divergence is only getting wider. For Sellers this is great, other than concerns of increased contract cancellation rate. For Buyers, it means tight competition and rising home prices.

These two graphs represent the density of Active listings (left graph) and Ratio of Active to Under Contract Listings (right graph). South Jordan (84009) had the most Active Listings at the end of November, while Downtown SLC (84101) continues to have more Supply than Demand. This might be a useful graph when trying to understand what area might have less competition when looking to buy, or too much inventory when planning to sell, not that too much is really a thing right now.

These two graphs represent the Total # of New Listings for the Month (left graph) and the change in New Listings for that area compared to last year (right graph). Herriman (84096) again had the most New Listings for November, while Millcreek (84124) had the biggest increase in listings year over year. This might also be a useful graph when trying to understand what area might have less competition when looking to buy, or too much inventory when planning to sell. 
This set of graphs that shows the total number of Listings by Week (left graph) for 2019 and 2020, and then the Cumulative Number of Listings (right graph). The gap in listings slowly decreased from the high in June of 10% to just a 3% deficit in listings for the year at the end of December. 
This graph shows the average Selling Price and the # of Days on Market for listings that sold in November. West Valley (84104) had the lowest DOM (41 days) and avg price of $308K. Again, this points to selling and buying patterns for an area and is something to consider if you do not have a preference for where you live. 
Months of Inventory tightened again in December, as 2 two that turned positive in November reversed, leaving just Downtown SLC with a surplus of inventory. Different sources give differing guidance, but the NAR states an average of 6 months means there is equilibrium of Buyers and Sellers in the market. Downtown Salt Lake City (84101) still has the highest Months of Inventory 6 months, while West Jordan (84084) had the lowest at just under 3 days of inventory. If you are a Buyer and do not have a preference on location or if you do not like competing, again consider looking downtown. Now might be a great time to explore that area. 
Anyway, thanks for your time. If you’d like to connect or share your thoughts, I can be reached via email at craig@craigtheagent.com.
Please remember:
– Zip codes do not reflect subdivisions, and any given subdivision could have completely different trend than the zip code it is in.
– All graphical information is collected from UtahRealestate.com.
