 Facebook
 X
X
 Pinterest
 Copy Link

My wife and I were joking around the other day, and she said, “Since you have so much time, why don’t you write an article about how much money real estate agents make?” Well, here I am, lots of time, hopefully shedding some light on why real estate agents request a 3% commission, and why you should be willing (maybe not excited) to pay it to a good agent.
To define what a good agent is; they are ones doing more than just managing a transaction. They have knowledge, resources, and drive to help you achieve your real estate goals. Yes, any basic agent should be able to manage the transaction part (listing a house or opening doors and writing offers). And if you want someone to just do the transaction, there are brokerages/agents doing that at a lower rate, but do not expect to have the best experience or to save money in the end.
A few examples of a good agent (think HGTV):
- Available when you need them.
- Listen to and help you figure out what your goals are, and then present options for you to achieve them.
- Demonstrate ways you can get more value. Let you decide if you want to do them and help if you decide you do.
- Help you manage the balance between financial goals and wants/needs.
- They answer the phone.
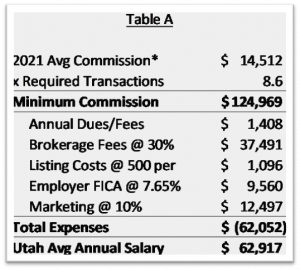 What does it take for a real estate agent to earn an average Utah salary of $62,917? I use the term “salary” since agents are licensed, do continuing education and are always available. Well, an agent must transact a minimum of 8.6 properties a year. Does not sound like a lot? I will admit, it is not on its own, but it is not the only thing an agent does.
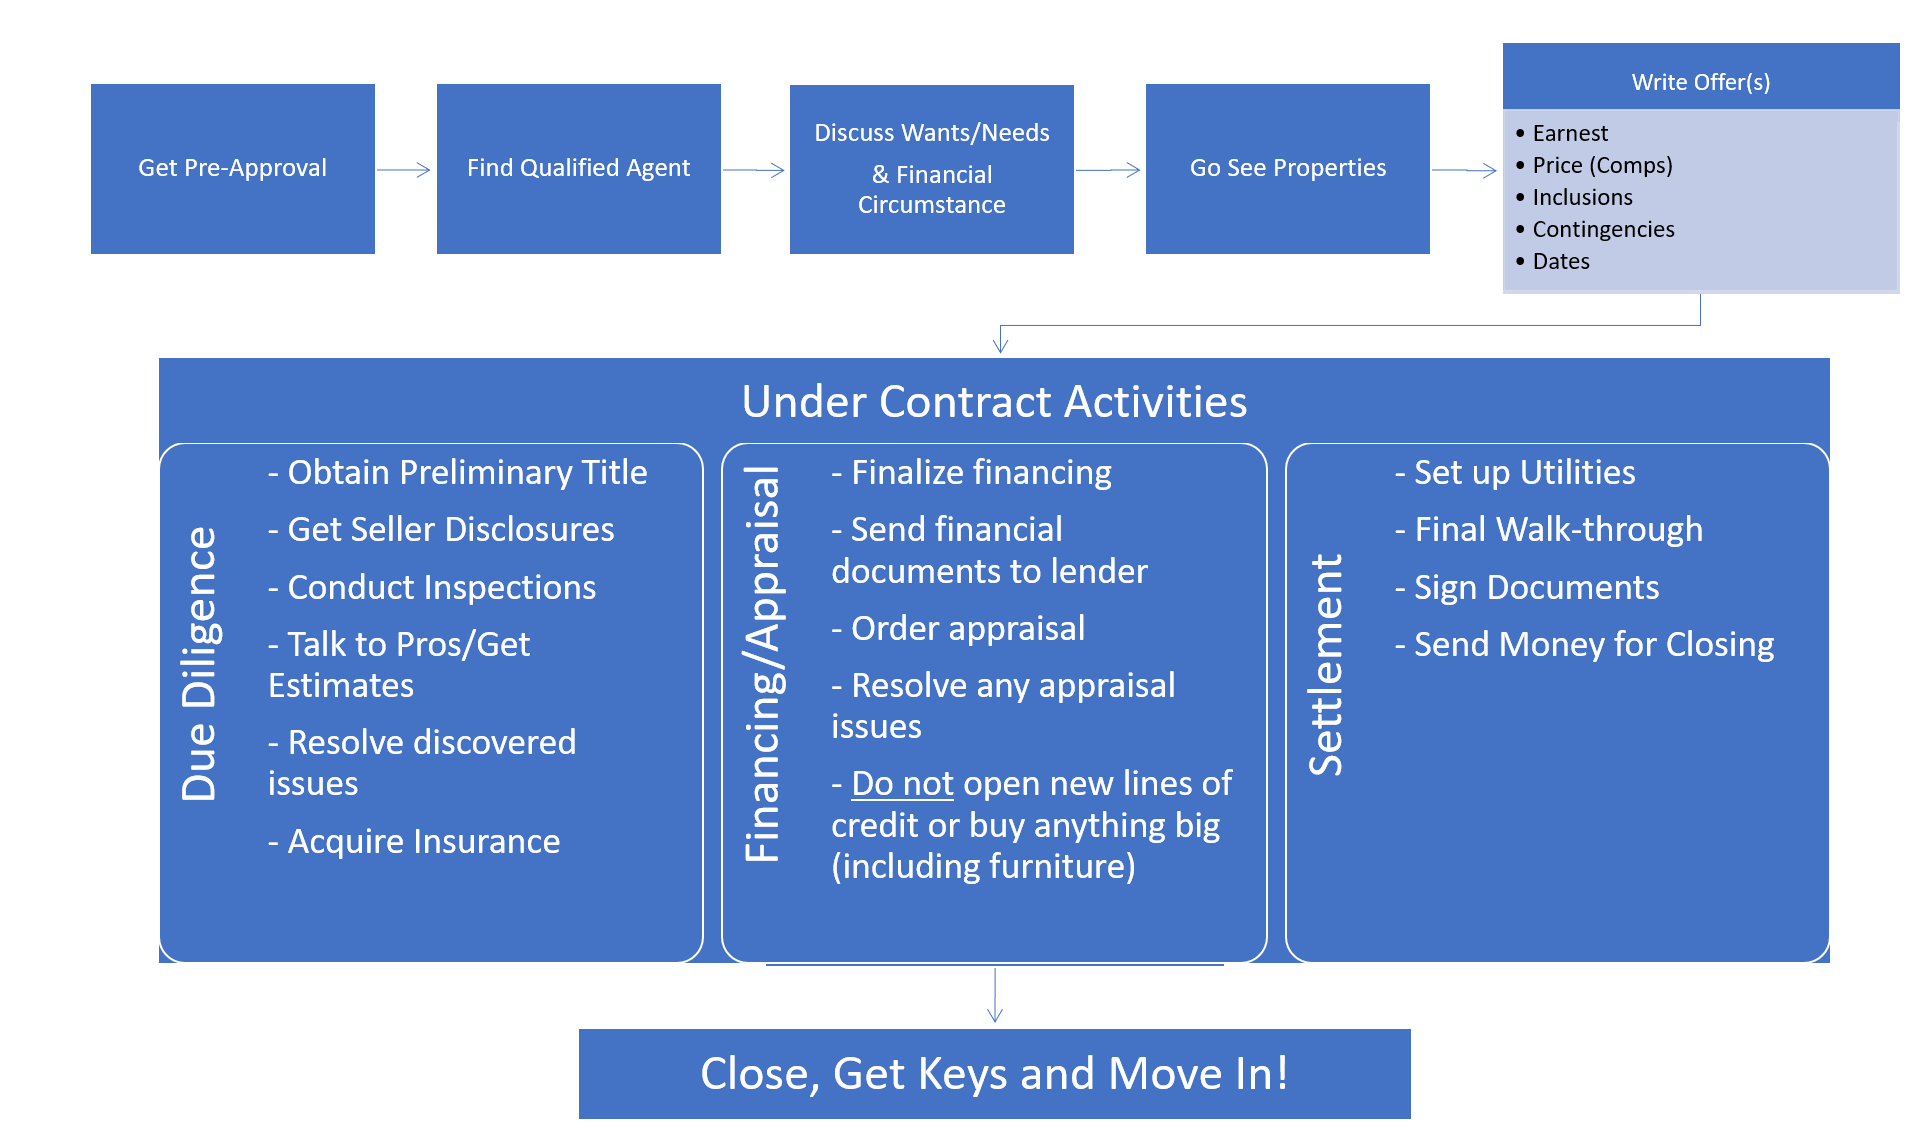
A rule of thumb for time use is 33% transacting, 33% prospecting new leads and 33% running your business. If on average, it takes 40 hours showing Buyers houses & getting Listings ready plus 40 hours once they are under contract, that is 1/3 (688/2080 Hours) of the work year already, so that only leaves time to do the other pieces of running a successful business.
Now you should ask, “8.6 transactions? Really? But the average home sells for ~$615K and you make 3% on each so that is $159K.”
Yes, in reality! The average commission in 2021 was $14,500 (not $18,450), and even at 8.6 transactions, it just gets an agent back to the average salary after expenses. See table A for details, but agents have expenses a salaried person does not, and most of these expenses Sellers & Buyers are not aware of.
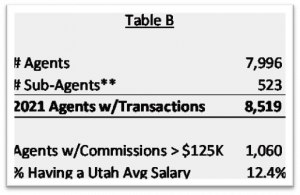 How many real estate agents make $125,000 in commissions each year? 12.4% or 1 out of every 8 (Table B). Not the best odds, and most agents do not get to that level of transactions for a few years. It is no wonder that in 2014, NAR reported 87% of all new agents fail before five years.
The argument for a 3% commission for a good agent; if a good agent is not making enough money, they will not be around to help you with buying or selling in the future, which could lead to costly mistake. Whether it is not getting the most money for your house or overpaying for something you are not happy with.
If you’ve ever said, “Agents make too much money”, you have been working with the wrong ones.
Anyway, thanks for your time. If you’d like to connect or share your thoughts, I can be reached via email at craig@craigtheagent.com.
P.S. Also Follow me on: Facebook, Instagram and LinkedIn. All tables were derived from UtahRealEstate.com data.
P.S.S. Lots of extra information & links
This data is not perfect, and I had to make some assumptions.
- *Buyer’s Agent Commissions are Public information but Listing Agent Commissions are not. For this I assumed they are equal.
- I did not split Commissions between Agents and Co-Agents. This would only increase the # of required transactions per agent.
- **Sub-Agents represent Agents that were Co-Agents on a transaction but did not have any transactions as an Agent alone. They generally give a higher split to the agent they work for. Again, this would increase the # of required transactions per agent.
- What each Expense represents, and these are not all, just the ones different from what a salary person would be paying:
- Dues are Realtor® fees and MLS member dues. Most agents can find free Continuing Education classes.
- Brokerage Fees represent a reduction to an Agent’s commission to compensate their broker for the services the Broker gives to the agent. This could be a higher or lower split depending on the Brokerage Model.
- Listing Costs are the expenses an agent covers to list the property on the MLS. (e.g. Photos, Advertising, etc.)
- FICA – Social Security and Medicare Tax paid by an employer, except for self-employed individuals, which they pay.
- Marketing – This is not advertising properties but advertising yourself to generate leads.
Articles I ran across while writing this
- Life As An Agent, https://placester.com/real-estate-marketing-academy/life-as-an-agent-survey-results#, surveyed 137 agents to identify how they spent their days.
- NAR Real Estate Facts from 2020 – https://www.nar.realtor/research-and-statistics/quick-real-estate-statistics
- Why Agents Fail – https://www.tomferry.com/blog/87-of-all-agents-fail-in-real-estate/
- Difference between Full-Service and Discount Agents (note this is not about the agent being a Good Agent) – https://www.sold.com/real-estate-tips-advice/what-sets-full-service-and-discount-real-estate-agents-apart

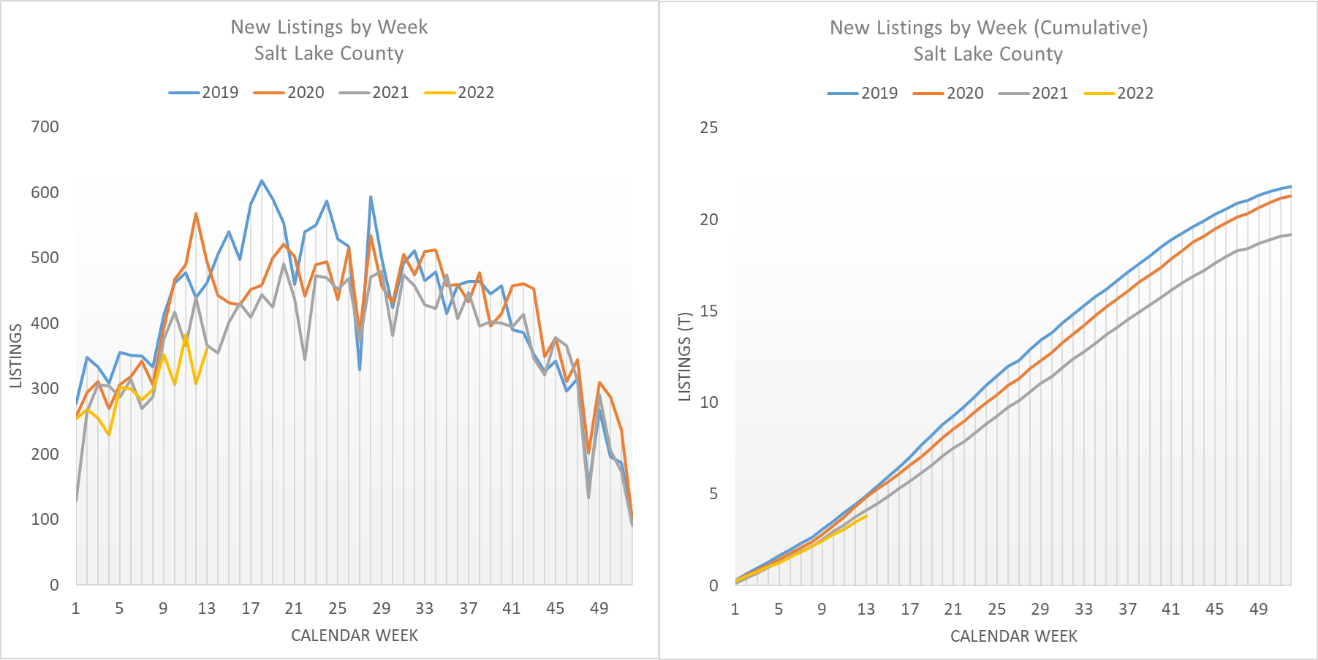
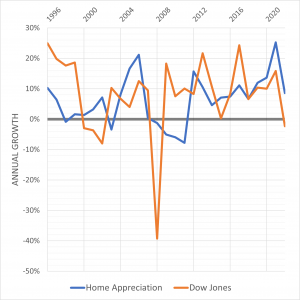 The data for this article only focuses on SLC since 1996, which is as far back as Utah’s MLS data goes. This does not mean the principles we discuss are not applicable other places, only that the Home Appreciation will be different. Also, I am using the Median Valued house, not Average. The Average is skewed by the high-priced homes, and not what most buyers are paying. As of March 2022, Median is $625K while Average is $691K.
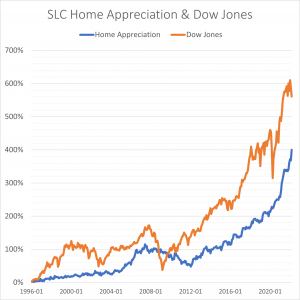 In this next chart, the same home appreciation and Dow performance is presented, but instead of looking at just the annual return, it shows the compounding effects of an investment. Over the same 26yr period, these effects on home appreciation is 4x and the Dow is 5.6x the original investment. This goes to show how time on an investment can make a huge difference.

 Especially during the aftermath of hurricanes, we learn just how many Americans lack hazard insurance. Those who did have it faced the challenge of trying to figure out how to tally up their losses. It’s not easy to recall everything one owns, especially when confronting devastation. Then, there are the other losses a homeowner might face, such as those from theft and fire.